Surface Quality Monitors - SQM500W

Model: SQM500W

TURN-KEY SYSTEM

The SQM500W is a fully integrated 3-D color graphics data computer, a motorized X-Y scanning stage (6″ X 6″ Travel) with 2-Axis controller, color printer and a SQM200W Surface Quality Monitor. All scanning and data acquisition is controlled by PETSCAN™ software.
The system can be used to scan a flat sample surface and acquire data using any analog sensing device. It displays graphics in both color map and 3-D Topo map formats, with the ability to print out a color hard copy. The data can also be printed out, in a matrix format, listing the X,Y position and associated signal value.

Would you like a personalized quote?
Image

SOFTWARE FEATURES DESCRIPTION

Scanning

Enables the user to scan any flat sample surface, acquire data and display a color map on the monitor. The user can define the number of data points to be collected in the X and Y directions, and the stepsize (the distance between data point). All scan parameters are automatically saved and recalled to scan additional parts or re-scan the same part after some surface treatment. This feature is helpful in visualizing the effect of any treatment/changes to the surface.

Color Graphics Display


An interactive color graphics mode allows rapid visual analysis of the data. In this mode, the user has the ability to PAN and ZOOM onto a portion of the color map. The ZOOM portion can also be saved as a file. Two color maps can be displayed simultaneously to visually compare any two scans. This enables the user to visually analyze the effect of any treatment or the variation in two parts. Another feature is the ability to normalize, i.e., subtract point-by-point, one file from another. The resultant file is displayed in a 3D type format.

A 3-D Topo map of the data can also be displayed on the screen. In this display mode, the user has the ability to tilt and rotate the image, and set the Z-axis scale factor to visually enhance differences in the surface characteristics.

Analog to Digital Conversion


An analog input of 0-5 VDC is standard for the system. Other ranges of DC signal can be accepted with a minor modification, done at no additional cost. The SQM500W can accommodate any instrumentation that has an output which ranges within the standard or modified analog signal range.

Report Generation


Any graphic image displayed on the screen can be printed on the color printer, which comes complete with the system. All scan parameters are also printed automatically. It is also possible to print all sensor data values, along with their corresponding X-Y position. The high, low, mean, and standard deviation of the scan are also printed out.

Image
Fully integrated and automated systems available.
Image
Solar Simulator has intensity measurement and feedback control for long term stability.
Image
True four-probe cell contacting technique.
Image
Systems equipped with advance I-V software have
Image
High quality Solar Simulator with computer control.
Image
Flexible cell test fixture configurations, including optional cell temperature control (10°C to 70°C ±0.5°C or better).
Image
True four-probe cell contacting technique.
Image
Multiple cell contacting probes for larger cells.

WHAT WE OFFER

Solar Cell Tester Repeatability Test

SKU


DESCRIPTION

SIZE

PRICE


12345

Image

Solar Tester Type 1 Description. Lorem ipsum.

2" x 2"
$150.40

12345

Image

Solar Tester Type 1 Description. Lorem ipsum.

2" x 2"
$150.40

12345

Image

Solar Tester Type 1 Description. Lorem ipsum.

2" x 2"
$150.40

12345

Image

Solar Tester Type 1 Description. Lorem ipsum.

2" x 2"
$150.40

DETAILED PRODUCT SPECIFICATIONS

DETAILED PRODUCT SPECIFICATIONS
X-Y Scanning Stage
  • 6″ x 6″ travel*, Motorized X-Y Scanning Stage. Sensor Holder with sensor clamp.
  • Manually operated micrometer for sensor height adjustment, 1” (25 mm) travel.
Desktop Computer
  • Current Model Computer System
  • Color Monitor
  • Keyboard
  • Current Model Color Printer
PETSCAN™ Software
  • Scanning Routines for defining step size, and the number of steps in the X & Y direction
  • File saving and management routines
  • Color Graphics Display routines with Pan & Zoom capability. Displays as a Color Map or Topographic Map
  • Displayed Screen Printing Capability
  • Data File Printing Capability
Model SQM200W System
  • Surface Quality Monitoring System

OPTIONS

  • *Larger X and/or Y Travel
  • Replace SQM200W Surface Quality Monitor with SQM300W or any other analog surface characterization sensors

Specifications subject to change without notice.

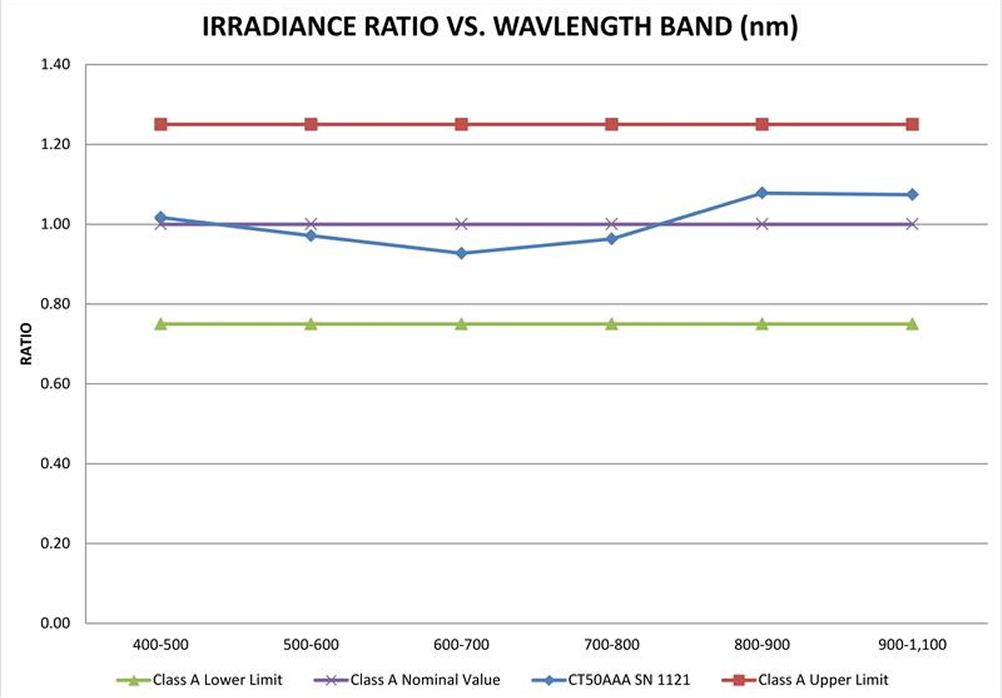
Spectral Match = +7.8% to -7.3%

Better Than Class A Spectral Match Requirements of ASTM E927-2010, IEC60904-9 Edition 2.0 2007-10 and JIS C 8912-1998: amendment 1-2005 & Amendment 2-2011 (≤ 25%)
Please click on image for a larger view.

Better Than Class A Spectral Match Requirements of ASTM E927-2010, IEC60904-9 Edition 2.0 2007-10 and JIS C 8912-1998: amendment 1-2005 & Amendment 2-2011 (≤ 25%)
Please click on image for a larger view.

Better Than Class A Spectral Match Requirements of ASTM E927-2010, IEC60904-9 Edition 2.0 2007-10 and JIS C 8912-1998: amendment 1-2005 & Amendment 2-2011 (≤ 25%)
Please click on image for a larger view.

    Image
    Would you like a personalized quote?
    Get in Touch